


 2019-06-25
in
2019-06-25
in

 12 min read
As I get ready to do a tutorial on a live simulator rendering using nothing but Avalonia it looked like using the standard event handlers in .NET and ReactiveUI that are the underpinning of Avalonia data flow would be the easiest way. There is a great example of this too with Nikita Tsukanov’s Avalonia BattleCity Game Demo which I was going to crib off. The first thing that came to mind though was what exactly is the throughput and overhead of .NET’s event handling system. Coming from Microsoft and with it being the core of many patterns not just the UI, but the UI is where we most often prominently see it, I was curious if it would break with large number of objects or handles. I didn’t expect it to be a slouch but exactly how far can it be pushed? This has most certainly done by others and probably even more thoroughly but this is new to me and I found it instructive. This is a write up of my exploration of this and the results.
Introduction
Before we deep dive on the how lets explore the why of this to frame the purpose. The purpose of this is to see if even in overly reductionistic cases how well the event handling system in .NET scales. Does it break at 100 handlers, 1 million handlers, 1 billion handlers, for example? Does it scale but exert a lot of overhead? What’s the rough order magnitude of events that can be handled per second? These are the sorts of questions I want to explore in a relatively simple and constrained test case. The how of that is to create some baselines of comparable activities up to and through very very simple event handlers and then to exercise it with every increasing numbers of handlers on an object, number of objects with handlers, and consequently large number of handlers in the system. Because handlers often have locking calls it will also be interesting to see what the performance looks like in simple handlers with locking versus non-locking functions.
I’m going to present raw numbers of calls per second (CPS) but this test wasn’t run on the latest and greatest machine. All tests were run on a 2-3 year old 4 physical core Intel Core i7-6700K processor at 4.2 GHz with 32GB of RAM running Linux Mint 18 and the .NET Core 2.2 runtime. It was the only major process active and the only one taking up substantial memory or CPU resources. These tests were run with a Release build of the application. The tests are not disk or network I/O bound at all so we should be able to see the raw performance factoring in nothing more than memory bandwidth, cache bandwidth, CPU bandwidth, the effeciency of the compiler and runtime, and finally the effeciency of the core libraries itself. These tests were not multithreaded at all so we are measuring a single-core performance. Generally through the test the process locked to one processor and maxed it out so I didn’t need to factor in a processor affinity problem in the operating system.
Each run is attempting to perform the same operation at least 100 million times to get a reasonably long runtime and avoid timing errors. The operation being performed is the update of a long counter. We will build up several means of doing this to figure out absolute highest throughput and then the overhead of the individual operations within the handler tests. We can then measure the effective throughput of the event handler cases versus the non-handler cases. We ran this test with as little as one object with one handler to one billion handlers for one object and 1 handler per object across up to 500 million objects. Lastly, the times we are recording to come up with throughput are strictly the time to increment the counter the requisite number of times. All bootstrapping and teardown is excluded. The only thing we have no control over is if there is a garbage collection event in the middle of a run, however based on the variability of the results this didn’t turn out to be a big factor.
The Value Class
We want to create the simplest possible handler class to be used around the counter incrementing examples. The simplest class is one that stores a value and implements the INotifyPropertyChanged interface. When it comes time we will be attaching one or more event handlers to one or more of these objects. The event handlers will fire and update the counter when the value is set/changed on our value class object(s). Our implementation looks like this:
public class ValueClass : INotifyPropertyChanged
{
    private long _value;

    public long Value
    {
        get => _value;
        set
        {
            if (_value == value) return;
            _value = value;
            OnPropertyChanged("Value");
        }
    }

    public event PropertyChangedEventHandler PropertyChanged;
    protected virtual void OnPropertyChanged(string propertyName = null) =>
        PropertyChanged?.Invoke(this, new PropertyChangedEventArgs(propertyName));
}
Benchmark Highest Throughput
The highest throughput we are going to get in incrementing a counter is going to be a tight for loop. We therefore have that method implemented so we can figure out the absolute fastest the .NET runtime can achieve. The code for that is directly below. On this machine the average throughput of this code was 800 million CPS with a 2.5% standard deviation.
for (var i = 0; i < count; i++)
{
    counter++;
}
Benchmark Locking Operation
For many event handlers we are going to have them calling into threadsafe code which will often use locks. The above code is technically not threadsafe. .NET has a mechanism for incrementing a variable in a threadsafe way which is the Interlocked.Increment method. Looking at a similarly tight for loop but using the Interlock mechanism we were able to get an average throughput of 230 million CPS with 2.9% standard deviation. The average throughput is ~28.5% of the direct increment operation tight loop. This will be useful to create a more fair benchmark for our handler operations. We also ran this with a method call instead of directly in the for loop but it had a negligble impact, as expected.
for (var i = 0; i < count; i++)
{
    Interlocked.Increment(ref counter);
}
Benchmark Value Update
The event handler is going to be fired off whenever we update the value on our ValueClass object. We therefore need to factor in the overhead associated with this operation as well. We measure that with the below code where we create one object and incrementally set the value the requisite number of times. As you can see the stopwatches are strictly on the loop part, which will be the same for the rest of the code you’ll see. In this case we were able to get an average throughput of 496 million CPS with a 0.1% standard deviation. That puts its performance at about 62% of the direct incrementing tight loop but 216% faster than the locking incrementing tight loop. Because the event handling is going to be triggered by the updating of a value and then in the handler we are going to do the counter increment this is the best benchmark to look at to see what the overhead of the handler itself is.
var v = new ValueClass();
counter = 0;
var stopwatch = Stopwatch.StartNew();
for (var i = 0; i < count; i++)
{
    v.Value = i;
    counter++;
}

stopwatch.Stop();
Benchmark Value Update on Array
We can perform a similar sort of benchmark above by looking at the overhead when it is being operated on an array of ValueClass objects all updated once. The code for this looks like below. We are creating 100 million objects and iterating through each updating the value and each time incrementing the counter. This takes a bunch more work so it was only able to perform 282 million CPS with a 1.9% standard deviation, about 57% of the value when doing this with just one object. Again this should be thought of as a good benchmark for looking at the handler case for many objects. When doing the below with a locking increment it drops down to 148 million CPS.
var values = new List<ValueClass>(iterations);
for (var i = 0; i < iterations; i++)
{
    var v = new ValueClass();
    values.Add(v);
}

counter = 0;
var stopwatch = Stopwatch.StartNew();
for (var i = 0; i < iterations; i++)
{
    values[i].Value = i;
    counter++;
}

stopwatch.Stop();
Handler Test #1: One Object, Multiple Handlers
For our test case where we are looking at the performance of just having one object with many handlers we have the below code. The method takes a totalCount number of increments to be performed and n number of handlers per object to perform them over. It creates just one object and adds the n number of requested handlers. The handlers themselves are either the simple, non-locking counter++ or locking Interlocked.Increment method we used in the tight loop benchmarks. Notice that we aren’t directly incrementing the counter. We are setting the value of our ValueClass object. Each time that happens each of the handlers gets called. When all iterations are complete and all handlers have finished the counter is confirmed to have the correct value requested.
var iterations = totalCount / n;
var v = new ValueClass() {Value = -1};
AddDelegates(v, n, locking);
counter = 0;
var stopwatch = Stopwatch.StartNew();
for (var i = 0; i < iterations; i++)
{
    v.Value = i;
}

stopwatch.Stop();
Handler Test #2: Many Objects, One Handler
The array case is very similar to the single case except we need to add the handlers to each object. In some cases we just add one handler to an object and in others we add multiple to the many objects as well. Again though the counter is incremented solely through the handler only when we change the value for each of the objects. We then make sure that the counter value matches the expected value.
var iterations = totalCount / n;
var values = new List<ValueClass>(iterations);
for (var i = 0; i < iterations; i++)
{
    var v = new ValueClass() {Value = -1};
    AddDelegates(v, n, locking);
    values.Add(v);
}

counter = 0;
var stopwatch = Stopwatch.StartNew();
for (var i = 0; i < iterations; i++)
{
    values[i].Value = i;
}

stopwatch.Stop();
Results
So what does this look like in terms of performance with just one object and one handler? We are getting about 126 million CPS with a non-locking handler and about 84 million CPS with a locking handler. That means for the locking case with one object and one handler we are hitting about 25% of the benchmark no-handler without a locking update case and 37% of the benchmark no-handler case when we have a locking update. I was expecting a degradation but I didn’t think it would be that dramatic. What happens as we increase the number of objects and handlers? Does it get worse? In fact what happens is we start to see a pretty fast improvement until we reach a saturation point where it levels off. To get a full picture we march through the number of handlers on an object starting at one and going up to 1 billion for both a locking and non-locking incrementor:
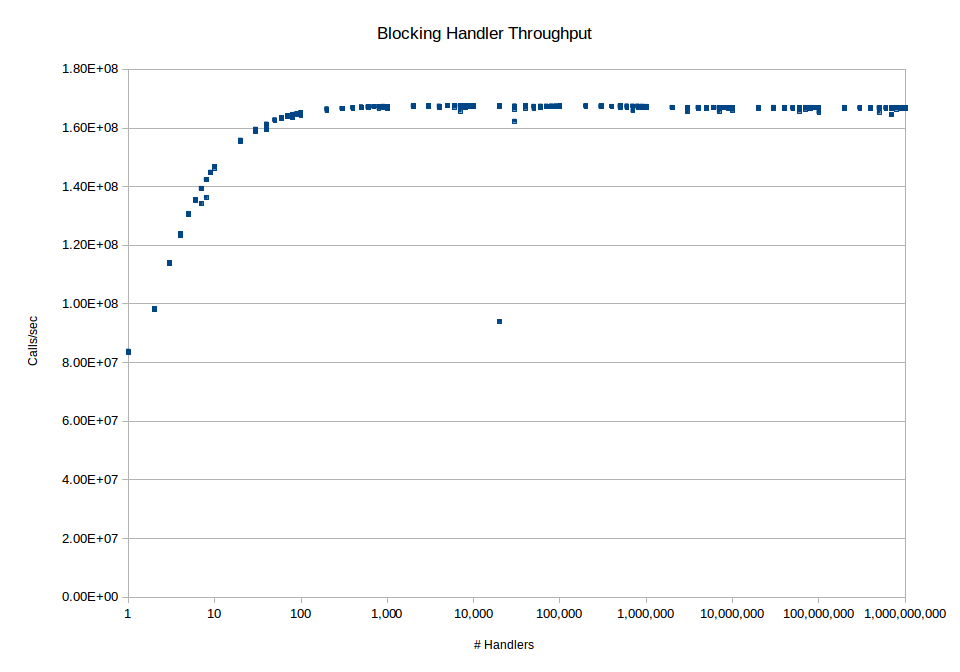
Figure 1: Handler scability on a locking operation
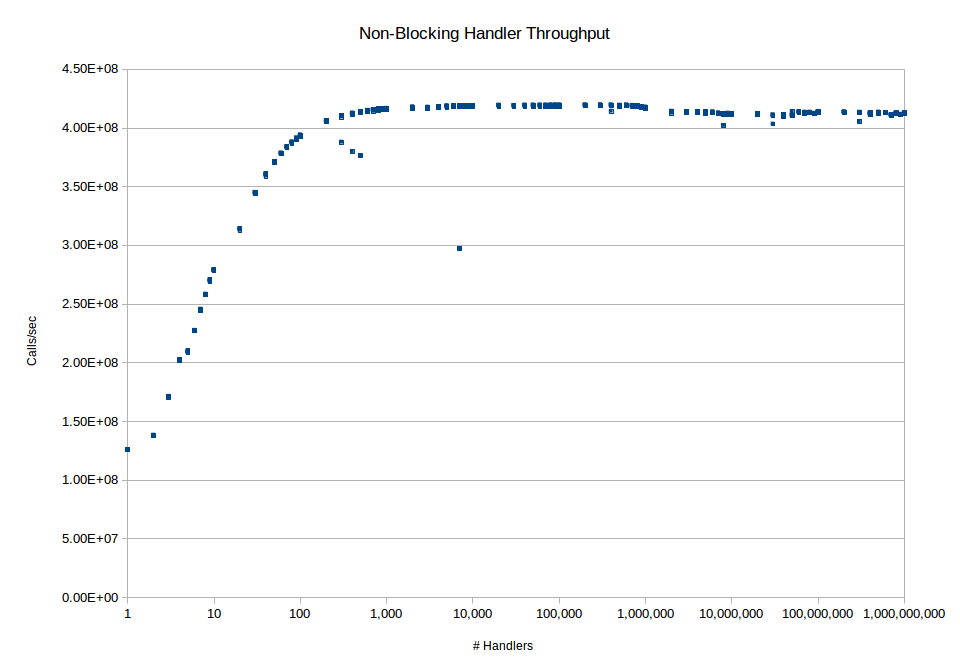
Figure 2: Handler scability on a non-locking operation
As we can see in the case of the locking operation we end up topping out at about 167 million CPS. In the case of the non-locking operation we end up topping out at about 419 million CPS. In the case of the locking operation this topline value is rock steady. In the case of the non-locking operation there is a slight degradation when we start approaching and exceeding 1 million handlers on an object however it only drops down to about 414 million or so and stays at that level out to 1 billion handlers. The earlier parts of the curve also show that the performance in this case increases pretty dramatically when we go from 1 to 20 handlers in the locking case and even higher in the non-locking case since the performance bottleneck in the latter case isn’t lock contention but the raw performance. When we look at the maximum performance with the event handlers we see that the non-locking case achieves about 84% of the performance of the non-handler baseline case and the locking achieves about 73% of the non-handler baseline case. In both graphs there are a few stray points. I’m attributing that to garbage collection events since it was not reproducible across runs.
To see what the effect of large numbers of objects we did the same tests but with combinations of large numbers of objects and handlers. The lower end performance of each one is comparable to but slightly worse than the single object case. The non-locking multi-object case starts at about 100 million CPS for one handler per object and then steady-state maxes out at about 390 million CPS for thousands of handlers across thousands of objects. The respective numbers for the locking case are 72 million CPS and 164 million CPS. As we can further see the locking case is really a matter of resource contention for the lock again so the real interesting thing is the non-locking case.
Conclusions
So what are we to make of event handling in the .NET run time? First, as expected there is a cost to doing things with event handling instead of raw looping. In the very simplified case of one object and one handle it has a pretty substantial performance penalty, achieving only 25-37% of the performance of a loop-based construct. However even in the single core case this performance substantially improves rather than degrades as the system has more handlers. In terms of the original question which was scalability there is a tremendous amount of scalability. Even with maxing out the memory of the machine to achieve a billion handlers and 500 million objects the performance when there are lots of handlers maintains its performance. In terms of raw performance for even small numbers of objects/handlers it’s still possible to get at least on the order of 100 million CPS per core with it only getting better as you throw more at it.