


 2021-12-13
in
2021-12-13
in

 12 min read
The first post on Dart benchmarking that I mentioned in this previous post is going to be on the minimum application footprint in terms of application memory and total run time. This exploration began as a side shoot of my benchmarking study when I was noticing some run time oddities for very short lived processes. From there I figured I might as well document the minimum file size, memory size, and run times. As part of this I’m going to be documenting the frequent extend pause in shutting the Dart processes down that often seems to add 1-3 seconds.
Methodology
File Size and Run Time Performance Testing Programs
The smallest program in the world is a traditional “Hello World” program:
void main() {
  print('Hello from dart');
}
This was run on all of the platforms both with a direct invocation of the source file:
dart run hello.dart
…and by compiling it into an executable form on each platform and running that executable:
# Compile the application (just run once)
dart compile exe hello.dart

# Running the application (each time)
./hello.exe
The executable form is also what is used to determine the smallest executable size on each system. I created a comparable C program in order to help with the diagnosing of the delayed shutdown behavior. This was to determine if this was a system-level problem that plagued all programs. That program was compiled with the system native compiler and run similar to the hello.exe executable created by the Dart compiler:
#include<stdio.h>

int main() {
  printf("hello from C\n");
  return 0;
}
Memory
The memory program is similar except we want it to have an indefinite wait so that we can use the system memory tools to investigate its memory profile. That was run both with direct Dart invocation and by compiling it into an executable just like the run time performance program:
import 'dart:io';

void main() {
  print('Hello');
  stdin.readLineSync();
  return;
}
Hardware
The test machines used were a First generation M1 Macbook Pro running macOS Monterey, an x64 i7-6700K workstation running Linux Mint 20, and Linux Mint 20 and Windows 10 VMs running on that. For an additional level of testing on this delayed shutdown behavior I also had an x64 Ubuntu 20 instance running in Digital Ocean.
Steps
For each of the configurations a shell script was generated that executes the various programs 30 times in a row without any delays. Each program is run through the time command line utility in order to extract real time (wall clock time),user time (actual program work time on CPUs), and system time (actual work time the kernel did for that process on the CPUs). These values are then transcribed into an OpenDocument spreadsheet for graphing and analysis when appropriate.
Results
File Size
First lets look at the simplest of these metrics, the minimum file size for compiled Dart binaries. The smallest file size for each platform was:
- Linux: 5.7 MB
- macOS: 4.7 MB
- Windows: 4.7 MB
This executable has a Dart runtime environment and our code combined. In terms of size it’s pretty reasonable by modern standards. While a C program would be measured in KB not MB, if we compare it to Rust’s ~3 MB minimum size it isn’t looking too egregious.
Memory Size
Next simplest to discuss is the minimum memory footprint. The memory footprint is divided into three metrics:
- Private Memory: Memory that is specific to the process and its functions
- Shared Memory: Memory that is allocated by shared libraries that the process links into itself.
- Total Memory: Usually the sum of the private and shared memory of the process. This is made somewhat more complicated on systems like macOS that do memory compression and other techniques. For the purposes here we will simply be adding the two together
The calculation is done for both the dart run runtime running method and by running the compiled executable version. The “compiled executable” has a small Dart runtime embedded inside it that is used for executing the compiled code. It therefore was expected to have a much leaner memory footprint. In fact it does both for private memory and shared memory:
| Total Mem (MB) | Private Mem (MB) | Shared Mem (MB) | |
|---|---|---|---|
| Windows | |||
| Dart Runtime | 122.73 | 106.02 | 16.72 |
| Dart Compiled | 10.5 | 3.8 | 6.7 |
| macOS | |||
| Dart Runtime | 118.4 | 100.6 | 17.8 |
| Dart Compiled | 28.2 | 10.5 | 17.7 |
| Linux | |||
| Dart Runtime | 102.8 | 7.5 | 95.3 |
| Dart Compiled | 9.9 | 5.4 | 4.6 |
In all cases there is a substantial reduction in memory footprint of the application. This is because the Dart runtime has several features like a just-in-time compiler (JIT), recompilation, live metrics, and other debugging capabilities. The compiled application does not have those things. This results in the memory footprint going down by an order of magnitude on Windows and Linux but “only” a factor of 4 on Mac. One thing I find interesting is how for Windows and Mac the private memory pool is the dominant one and on Linux it is the opposite of that. Based on my experience with memory footprints of Flutter programs these initial much larger footprints don’t have huge effects as the program allocates memory etc and instead is a byproduct of the runtimes themselves. This can be seen in the Linux inspector which shows several Dart blocks using >20MB of memory and other shared libraries using up decent sized chunks as well.
Run Time
This is where things get complicated which is why I’ve left it for last. My initial testing was all being done on VirtualBox VMs. On these machines I was seeing a pretty large delay in shutting down the program, both in the compiled and the dart run executed version. I initially assumed it may be a problem with the VM which is why the C programs were developed. A demonstration of the problem can be seen in the below animated GIF:
As you can see the program starts practically immediately, on the order of tens of milliseconds. After the text is printed it should shut down nearly as fast. Instead it often hangs for almost a second to up to three seconds. What is it doing? I’m not sure, but I’ll be exploring that below. You can see that the compiled version has this feature too although not as dramatic. To confirm that this isn’t a VM specific problem the compiled C program is executed. As you can see it comes back instantaneously. Assuming this was Dart specific problem at that point I went on until it was time to run these tests on the Mac.
On the Mac Dart is running on bare metal not in a VM. In that mode it never exhibited that problem over the 30 runs. I then went back to the Linux machine and ran the same test on bare metal and saw that there too it never ran into this problem. Let’s look at some raw statistics. To determine if this was perhaps a VirtualBox specific problem I ran the same tests in a virtualized instance in Digital Ocean. Unfortunately it is behaving just like on the VirtualBox VMs. What is going on here?
First lets set the baseline behavior of a small C-based application running on these various environments. Below is a chart of the 30 runs of the C program on the five platform configurations (Linux Workstation Bare Metal, Linux Workstation VM, Windows VM, Mac, Digital Ocean Linux VM):
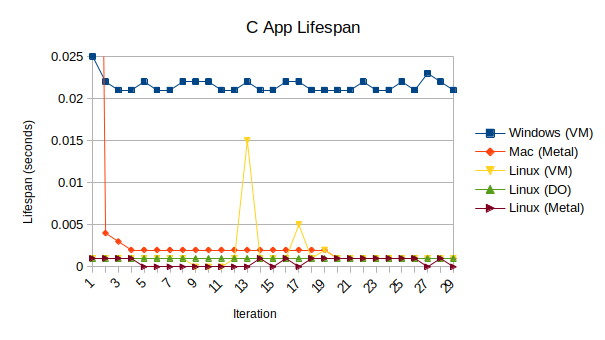
In all of these cases the run times of these apps from start to finish, including writing the “hello” text to the terminal, is mostly steady. The first Mac run took 155 ms but never again took more than 4 ms and after several runs never more than 1 ms. The Linux on bare metal is anywhere from less than 1 ms to 1 ms, both on the Digital Ocean VM and the workstation VM. The Linux VM running on the same workstation mostly in the 1 ms range but with some jumps up to a few milliseconds and one errant case all the way to 15 ms. The Windows VM on the same workstation maintained a pretty consistent ~22 ms time. With this we can assume that even with no other major work being done on the machines that we can expect to periodically see noise events that could be on the order of 10-20 ms. Unfortunately the variations for the Dart VM and the Dart compiled programs are often drastically higher than that.
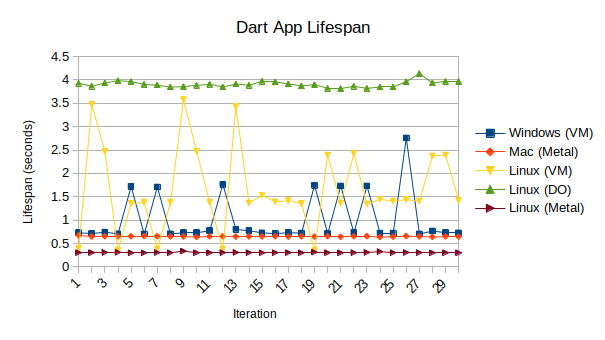
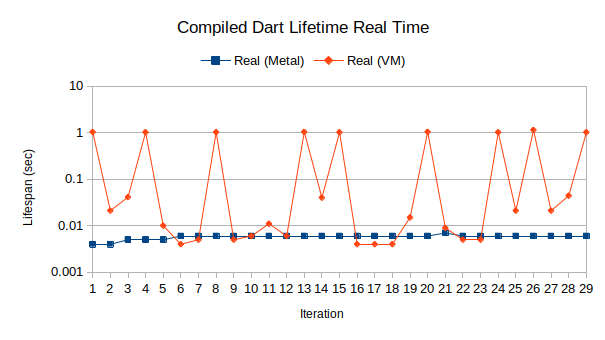
There is intermittency to this extra shut down time. Up in Digital Ocean it always exists. On the workstation it seems the Windows VM collapses back to the closer to bare metal delay rather than having the multi-second delay. The Linux VM is far more noisy. The behavior for compiled Dart code is better but still exhibits the same behavior within the VM:
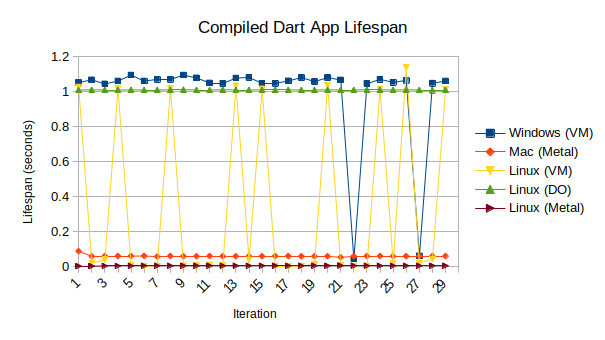
Again, up in Digital Ocean the behavior is far more consistent but unfortunately consistently there. In this case it was the Windows VM that was more consistently poor across the runs but in all of the cases the Dart compiled executable running in the VM is exhibiting this delayed shutdown behavior. Is this a case of the shutdown doing more work for some reason in the VM or is there a wait state being induced in the VM by something? To look at that lets break down the process time into its constituent pieces.
The time tool reports back to us lots of operating system generated metrics about our process. In this case the time fields have three distinct measurements. The first, “real time” measures how much physical time the process existed for. This would be the equivalent of getting a stopwatch out and measuring it yourself. It also measures “user time” which sums up all of the CPU time the process actively used up over its lifespan. It also measures “system time” which sums up all of the kernel time that the system spent on doing stuff for your process as well. A program that sits there and does nothing will continue to crank up the real time but won’t be adding up much time in the other categories while a busy process will do both. To give an extreme example let’s look at two programs. The first program runs a tight while loop for ten seconds while the second one just sleeps for ten seconds:
// "Busy" Program doing tight loop for 10 seconds
import 'dart:math';

void main() {
 print('Start');
 final stopWatch = Stopwatch();
 stopWatch.start();
 var sum = 0.0;
 while(stopWatch.elapsedMilliseconds < 10000) {
   sum += Random().nextDouble();
 }
 print('Sum: $sum');
 print('Finish');
}
// "Not Busy" Program doing nothing for 10 seconds
import 'dart:io';

void main() {
 print('Start');
 final stopWatch = Stopwatch();
 sleep(Duration(seconds: 10));
 print('Finish');
}
| Real Time (sec) | User Time (sec) | Sys Time (sec) | |
|---|---|---|---|
| Busy App | 11.278 | 10.046 | 0.228 |
| Not Busy App | 11.220 | 0.263 | 0.078 |
If we look at the corresponding times for both of these programs we can see from the data above the “busy app” racks up a bit over 10 seconds of CPU time in user space and a quarter second of kernel time while the sleep app logs barely any user or kernel time at all. At the same time the wall clock time for both are basically the same. So the question then is are these Dart shutdown delays being caused by a differential in user or kernel level cleanup work or some other form of delay. Below are graphs comparing the user, system, and real times running in the VM and on bare metal on the same workstation:
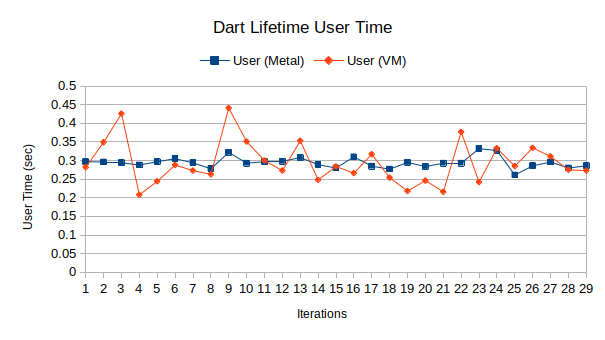
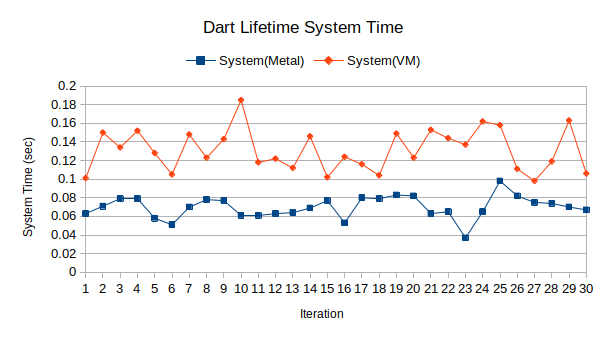
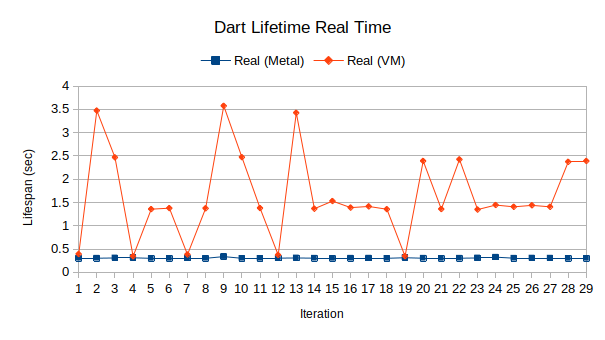
The VM user times are definitely noisier but within the same average range. The VM system times are measurably larger than on bare metal. However both of these deviations are less than 10 ms. In contrast the wall clock times between the VM and bare metal vary by 1-3 seconds with the exception of a few cases where it collapsed back to the same time as bare metal. Looking at the compiled version we see a similar pattern:

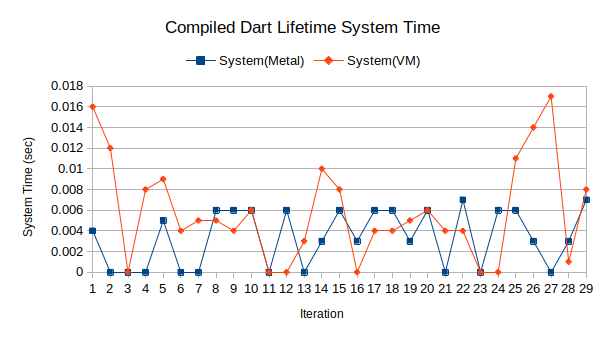
In this case the VM and bare metal statistics on user and sys time are equally noisy. This is driven a lot by the fact that the values are an order of magnitude lower. In this case while we have more cases of the VM real time collapsing down to the bare metal performance and the delayed cases being 0.5-1 second instead of 1-3 seconds, they are still there and don’t correspond to actual work being done. So what is the cause?
It isn’t some latent virtualized OS problem that afflicts all programs since the C program never experience anything like it. It also isn’t something specific to the VirtualBox virtualization since the Digital Ocean instances also had similar overly long shutdown times. On Digital Ocean the user and sys time add up to less than a second for each of those ~4 second process times and less than 10 ms of the 1 second compiled process times. We also know that the Digital Ocean instance can cycle the C application in 1 ms or less repeatably. I don’t have an answer as of right now. It’s something I want to explore with the Dart/Flutter community, hence this blog post. The behavior has been documented by others with tracing details in this GitHub issue but they don’t have any identified culprits yet either. Their first guess as to why was a dead end. So the mystery continues.
Conclusion
There are three big takeaways from the Dart minimum app study. First, compiling Dart applications can create reasonably sized (~5 MB) self contained executables that consume reasonable amounts of memory (~ 10 MB on Linux and Windows, ~30 MB on macOS). While the absolute value of the memory usage is pretty high for a program that does nothing, it is a bootstrapping cost which quickly goes into the noise for many real world applications. For comparison even little vi with no added plugins nowadays uses about 9 MB of memory on startup. If running in production with the full Dart VM however there can be substantially more memory usage than that.
With respect to minimum program execution time the overall cycle for a compiled app is milliseconds and for the Dart VM run app less than 1/3 of a second. These times are solid. There is the wrinkle about the delayed shutdown when virtualized however. In applications where you have long lived processes, such as a user application or a back end service, this is truly negligible. Processes that aren’t cycled regularly aren’t going to be substantially impacted by needing an extra 1-3 seconds to shut down after running for minutes, hours, days, or longer. However there are use cases where there is a lot of process churn and the lifespan of the process is itself measured in seconds. In those cases this could add a lot more delay to the system. Since it isn’t productive work it isn’t necessarily adding overhead. However if the parent process is waiting for it to exit before doing something else it could impact performance. It’ll be interesting if the nature of it can be diagnosed and corrected.