


 2026-01-09
in
2026-01-09
in

 20 min read
Another year in the books provides yet another opportunite to look at how things have held up for me on the longevity/health objectives I set out for myself. In 2023 I started a fitness reboot that totally transformed my mindset on exercise and rebooted my nutrition too. In 2024 I continued that momentum forward to the most dialed in year I ever had. I achieved athletic goals that I wasn’t sure I’d ever be able to hit again. I had hoped to maintain that momentum into 2025. For the most part I did do just that.
Goal Accountability
Heading out of the first really dialed in full year I had a lot of momentum going for me on the goal accountability front. These were the essential elements of diet, exercise, sleep, and an aspect of brain health that are pretty much what I think I need to run over the long term. The only goal I vascillate on being sufficient is the brain health one. I’ll get to that later. My criteria for each goal had reached a steady state definition that boiled down to:
- Goal 1 (Diet): Eat a plant dominant Mediterranean diet averaging at least 100 grams of protein a day, a stretch goal of over 120 grams of protein
- Goal 2 (Sleep): Get 7-8 hours of sleep a night
- Goal 3 (Cardio Health): Meet training plan goals set by coach
- Goal 4 (Non-Cardio Health): Meet training plan goals set by coach
- Goal 5 (Brain Health): 15-20 minutes of meditation or alternative learning, stretch goal of 15-20 minutes of meditation and alternative learning or a second meditation session.
While I did have a lot of momentum going into 2025 I did have some known stumbling points that were going to cause some dip in numbers. I had a couple large trips planned which would be full of indulgences and a few smaller ones too. Because of how they bunched up, in January/February and then in September/October, I knew that goals for that month, especially diet and sleep, were going to take some dings. I would not allow myself to skip enjoying some tasty but not great for me food and celebrations for shorter periods of time. With that all said lets look at how each of the grades panned out over the year:
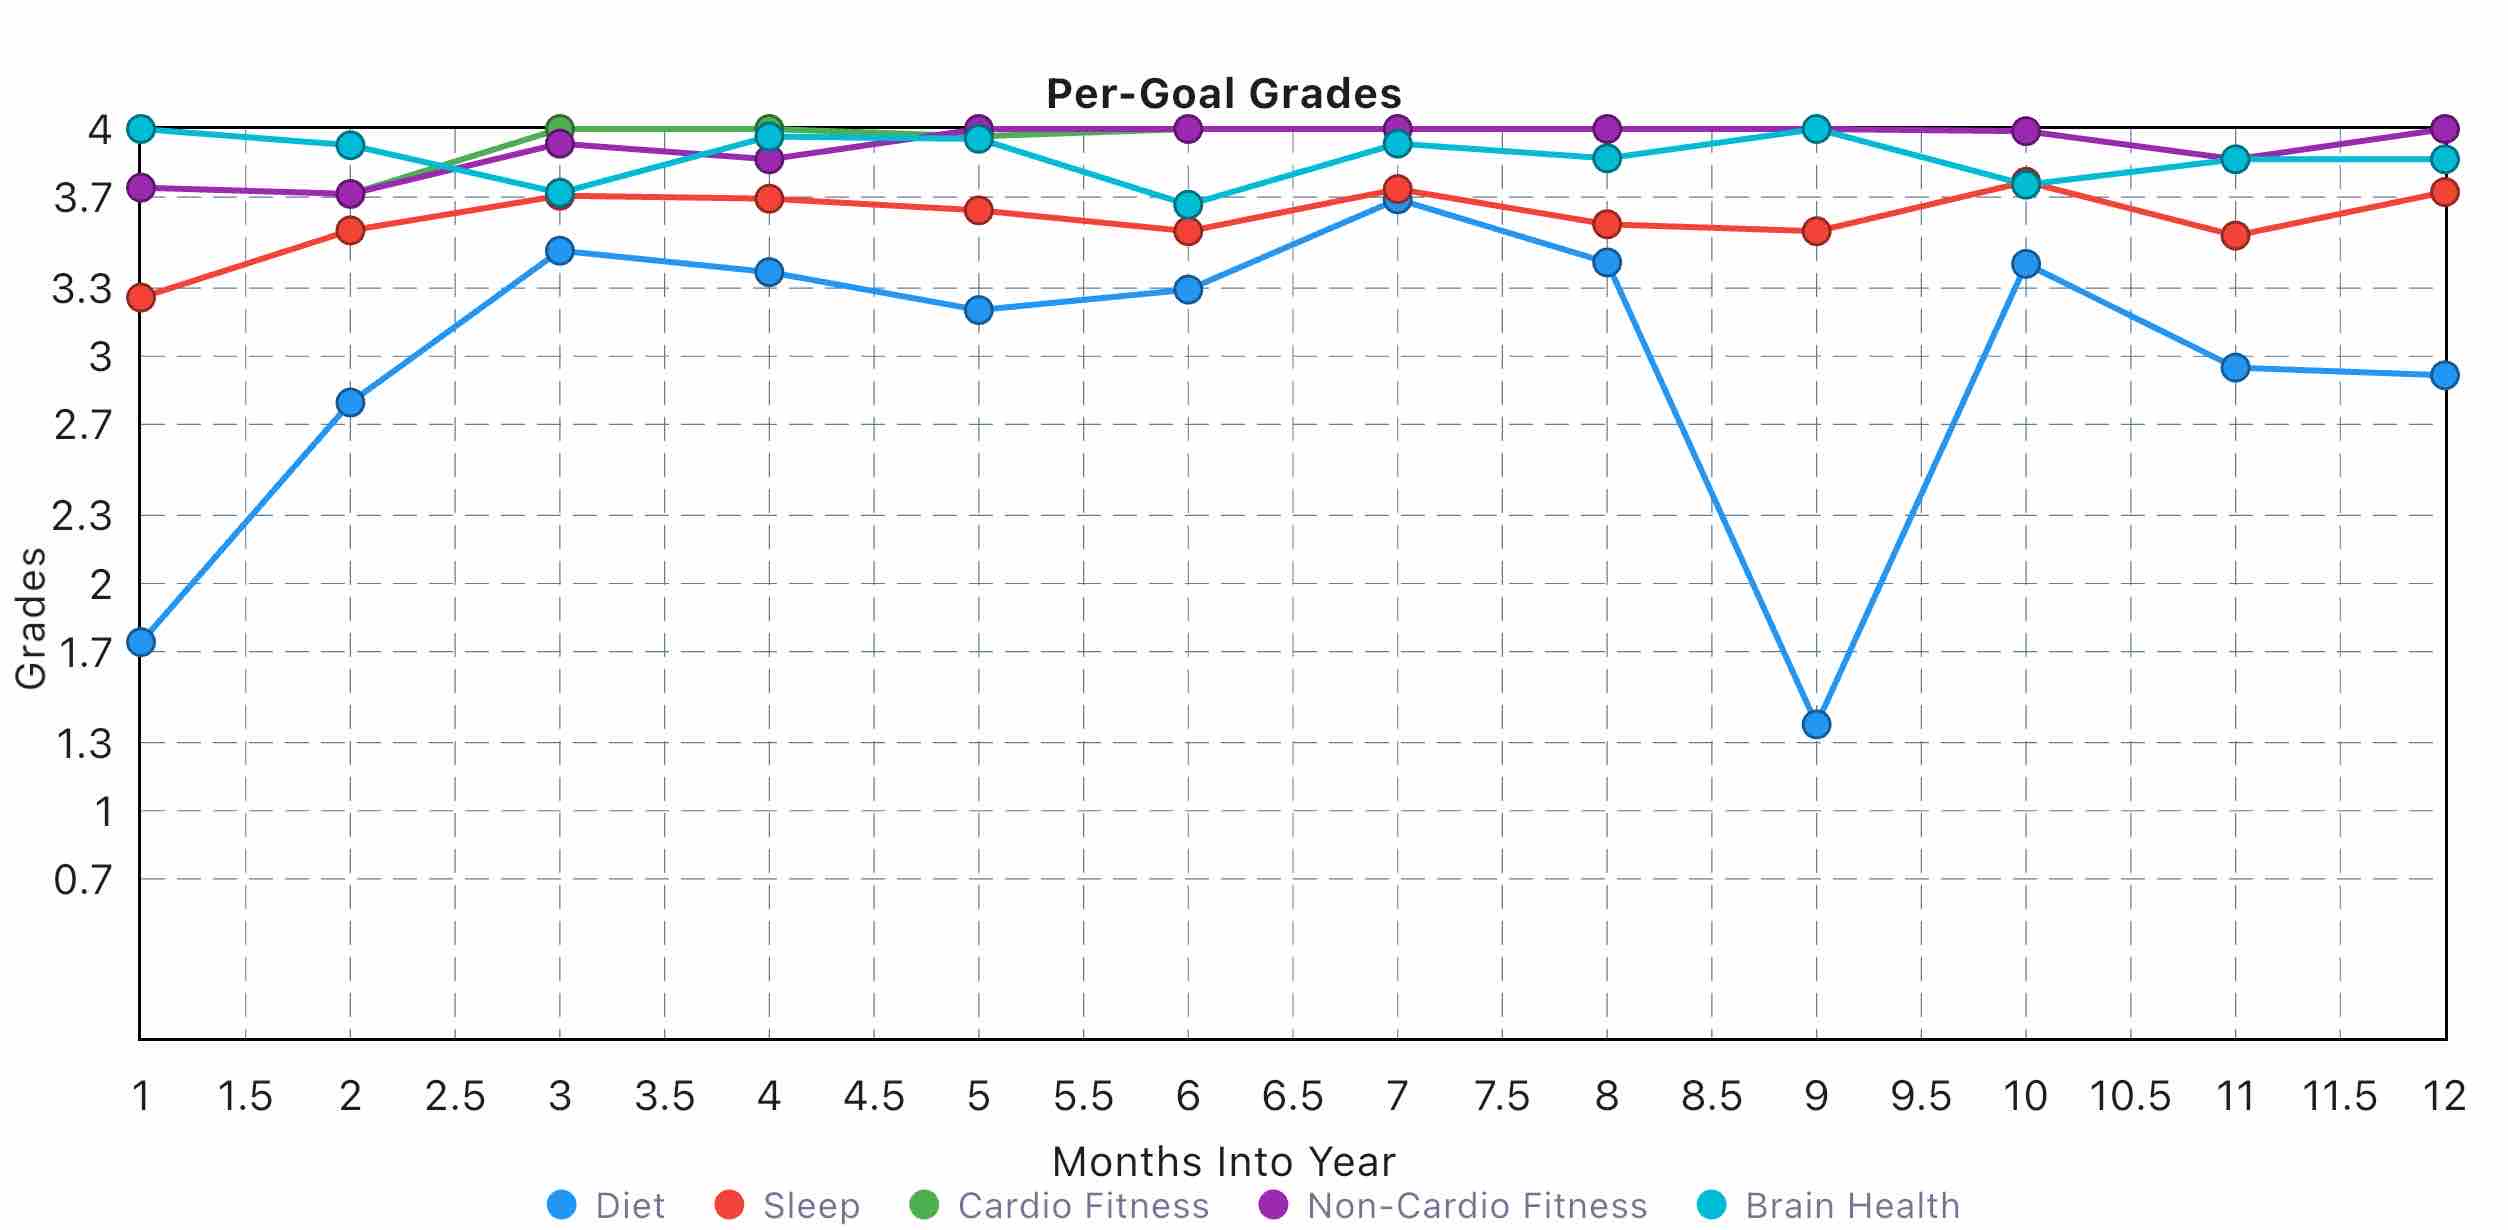
Figure 1: Accountability Grades Per Month
As the individual graphs show while I was able to keep my exercising and brain health dialed in and my sleep mostly dialed in, diet took a huge hit around those trips. I haven’t had grades as low as 1.7 or 1.38 since I started my fitness reboot. Since these were nearly month long trips I’m not surprised nor entirely opposed to those temporary dips. A month here and there of eating like crap in an otherwise healthy lifestyle over years and years isn’t going to make that much of a difference. As long as I can maintain a decent diet grade besides that I think I’m doing okay. It is because of that that I’m not 100% happy with the rest of the diet performance, especially in the last two months of the year. Yes there are some holidays there but a lot of what is dragging the diet score down is mindless eating of unnecessary junk at the house: Halloween Candy, excess treats brought home, excess indulgences of desserts at restaurants et cetera. I’m not talking about eating one or two cookies or having a candy bar for a snack on a given day. I’m talking about sleeves of cookies or multiple candy bars in an evening. When we get to the body composition number we will see the effect show up there as well despite a good amount of training.
The fact that I was able to keep up my training through pretty intensive travel trips and continue to have a mindset that feels that missing scheduled workouts is an anomaly and needs to come for a very good reason is wonderful to me. As I wrote last year, my life-long M.O. when it came to working out was to always have an excuse why today wasn’t the day to workout. Besides a few months here and there, and a couple year stint on just running but not weight training, I never had the mindset where I would get creative to figure out how to get my weekly workouts in. I like to think this is turning into a true hardwired difference but I don’t want to rest on my laurels about that.
Despite the dings from the diet score when you average the grades out overall, since diet is only 20% of the grade, the overall daily grade score isn’t too horrible:
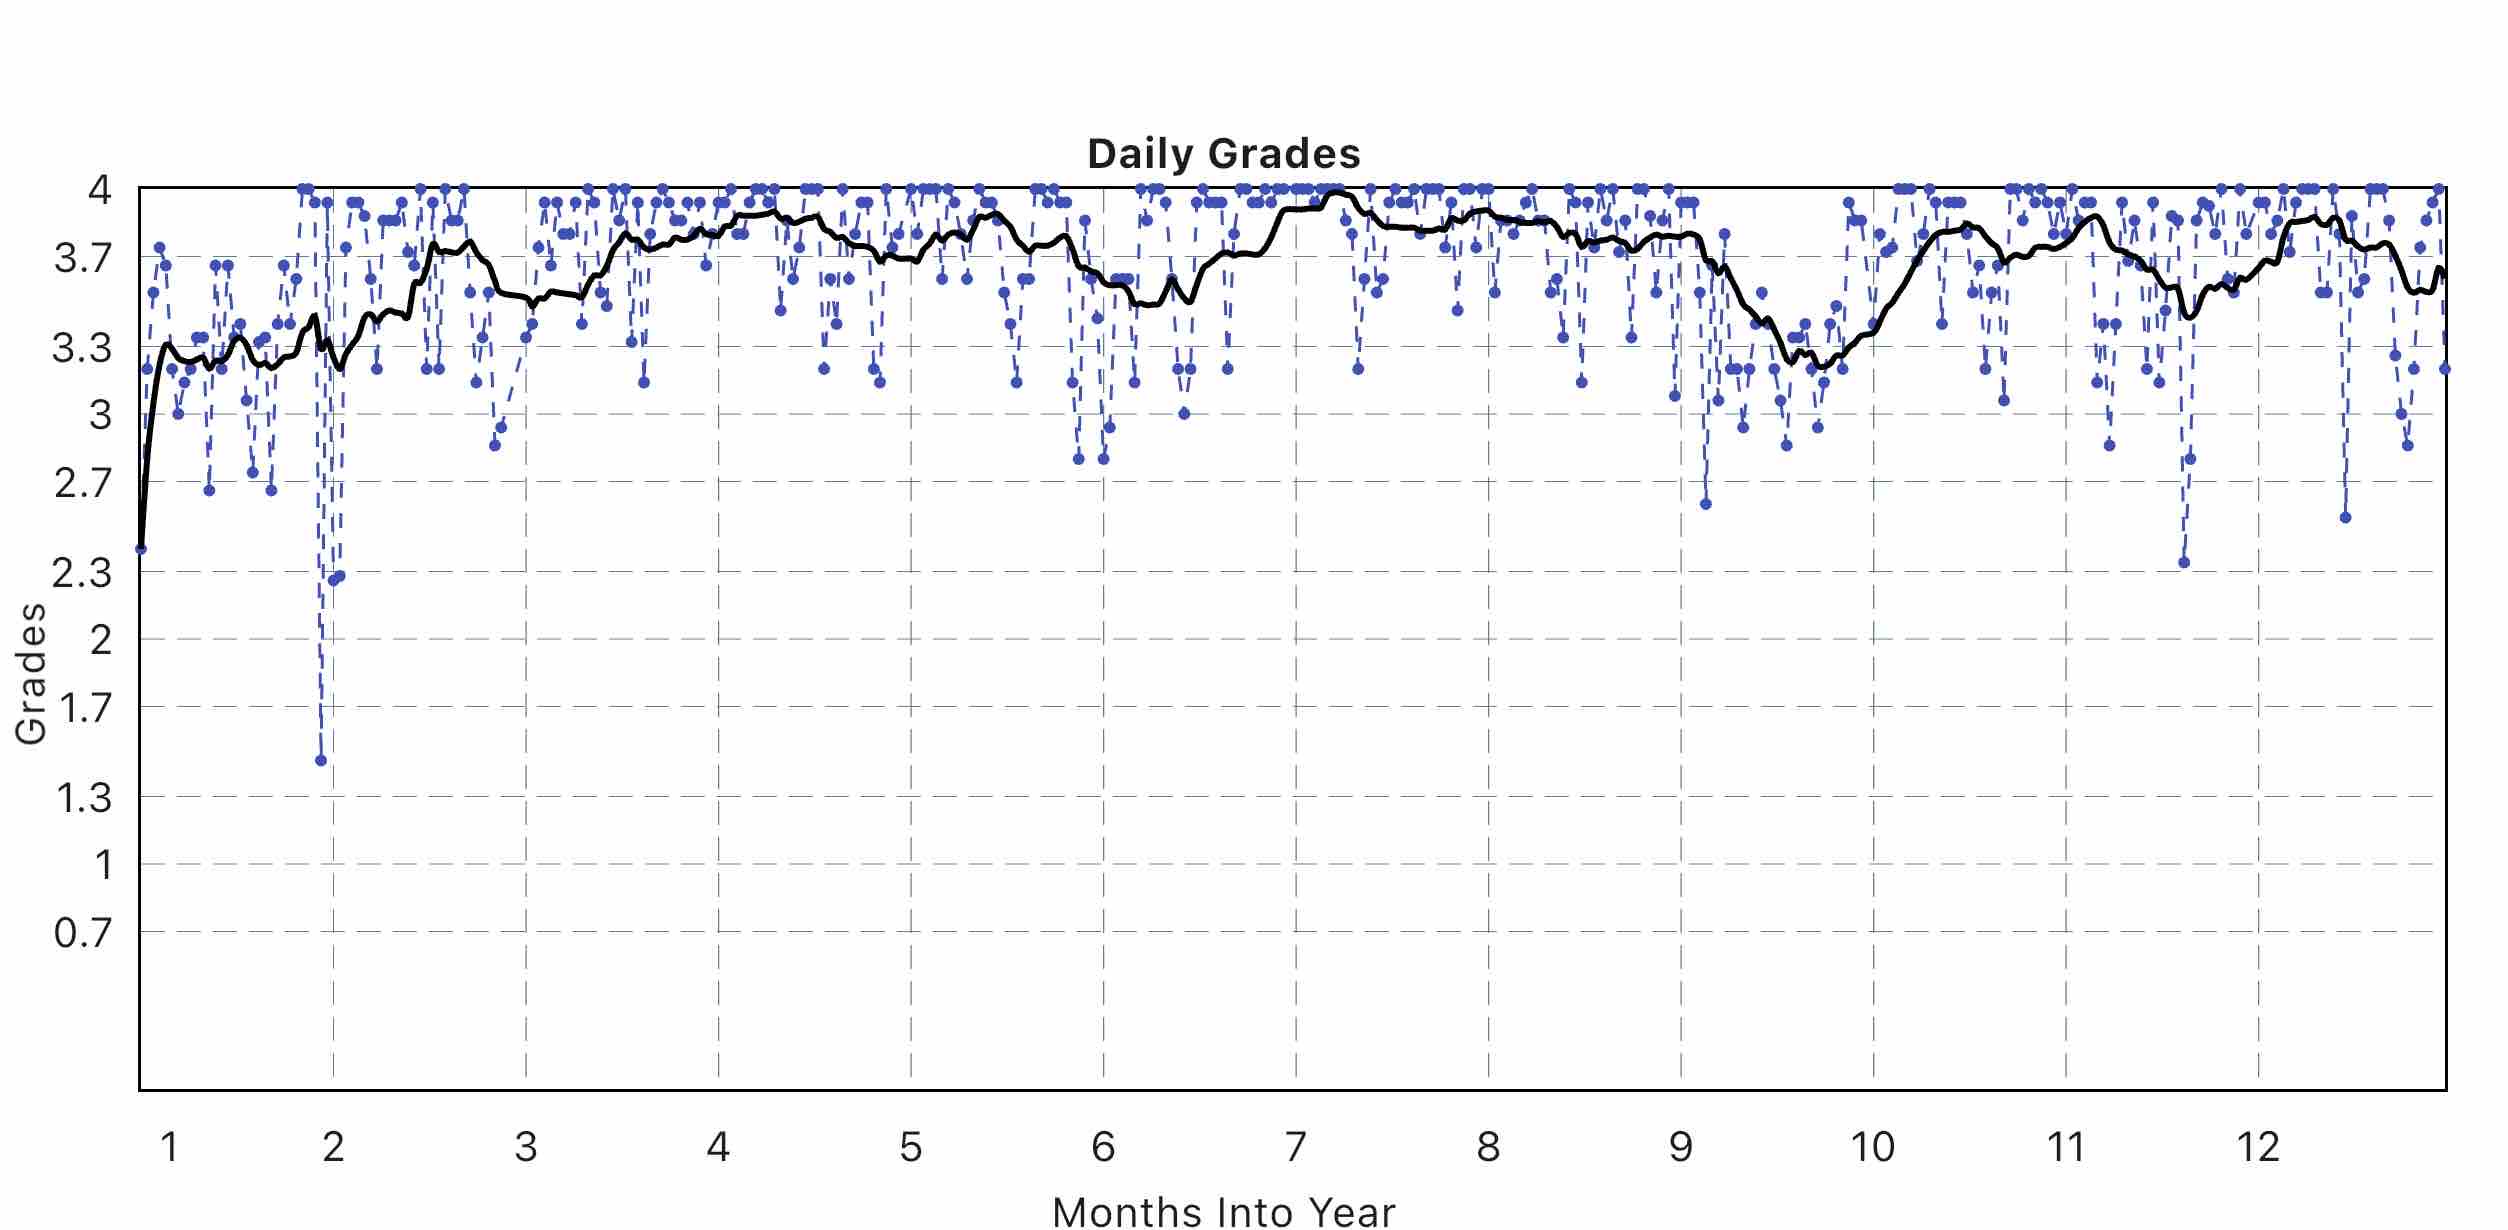
Figure 2: Daily Goal Aggregated Grades
There are a few dinged days where all the scores were low. You can still see the lower averages from the longer trips. However essentially the worst case stead state is still well above a 3.3 GPA. When we look at it compared to other years this turned out to be still one of the strongest years I’ve put in the books since I started tracking back in 2017:
| 2025 | 2024 | 2023 | 2022 | 2021 | |
|---|---|---|---|---|---|
| Goal 1 (Diet) | 2.97 (B-) | 3.15 (B) | 2.47 (C+) | 2.43 (C+) | 2.44 (C+) |
| Goal 2 (Sleep) | 3.61 (B+) | 3.50 (B+) | 3.42 (B+) | 3.50 (B+) | 3.65 (B+) |
| Goal 3 (Cardio Fitness) | 3.94 (A-) | 3.84 (A-) | 3.34 (B+) | 2.54 (C+) | 2.98 (B-) |
| Goal 4 (Non-Cardio Fitness) | 3.93 (A-) | 3.82 (A-) | 2.55 (C+) | 1.68 (D+) | 1.41 (D+) |
| Goal 5 (Brain Health) | 3.88 (A-) | 3.75 (A-) | 2.48 (C+) | 2.31 (C+) | 2.91 (B-) |
| Total GPA | 3.66 (B+) | 3.61 (B+) | 2.85 (B-) | 2.49 (C+) | 2.68 (C+) |
The overall GPA of 3.66 is the highest I’ve ever hit, just barely edging out the previous high score from 2024. Cardio fitness, non-cardio fitness, and brain health goals also logged the best scores to date as well. Sleep, while not at the A level still had the third highest level. While diet took a bit of a ding compared to last year and dropped from B to B- was also still the third highest score for that grade.
Could I have done better on any of these scores? Yes. I think with some tweaks I should be able to get sleep a bit more dialed in. On the diet front I think I could have had things more dialed in outside of trips as well. I started reading up on something called Intuitive Eating, which is not the “eat whatever you want and don’t worry about it” shtick some social media influencers peddle. I also have been reading up on proper nutrition for endurance athletes. I’ve started experimenting with both of those concepts and hope that by incorporating more of that into my eating and diet planning I can help address some of the ingrained behaviors that lead to some of the diet issues, namely nightly gorging on junk food and being unable to not eat everything on my plate at restaurants even when the serving sizes are ridiculously large. I do hope to eventually do some write up on that here at some point.
On the Brain Health, while I did get a good score I also think that the goal is inadequate for what I’m trying to accomplish with longevity. Brain Health is about doing things to ensure that I stay mentally sharp. Meditation and non-reactivity, the primary things I’ve been pushing on, do help with those things. However I still over-indulge on social media and current events stuff that drive me crazy. This is without having the excuse of being on algorithmically driven big tech social media sites. It is truly my own doing. So while I technically got a good grade for the year I’m planning on making the criteria more appropriate, which at the same time will make it more challenging.
Nutrition
As we saw in the grading section my diet wasn’t as dialed in this year as it was last year. The question is if that shows up in the data for the year as well. It turns out that it does in some ways, although things still not too bad:
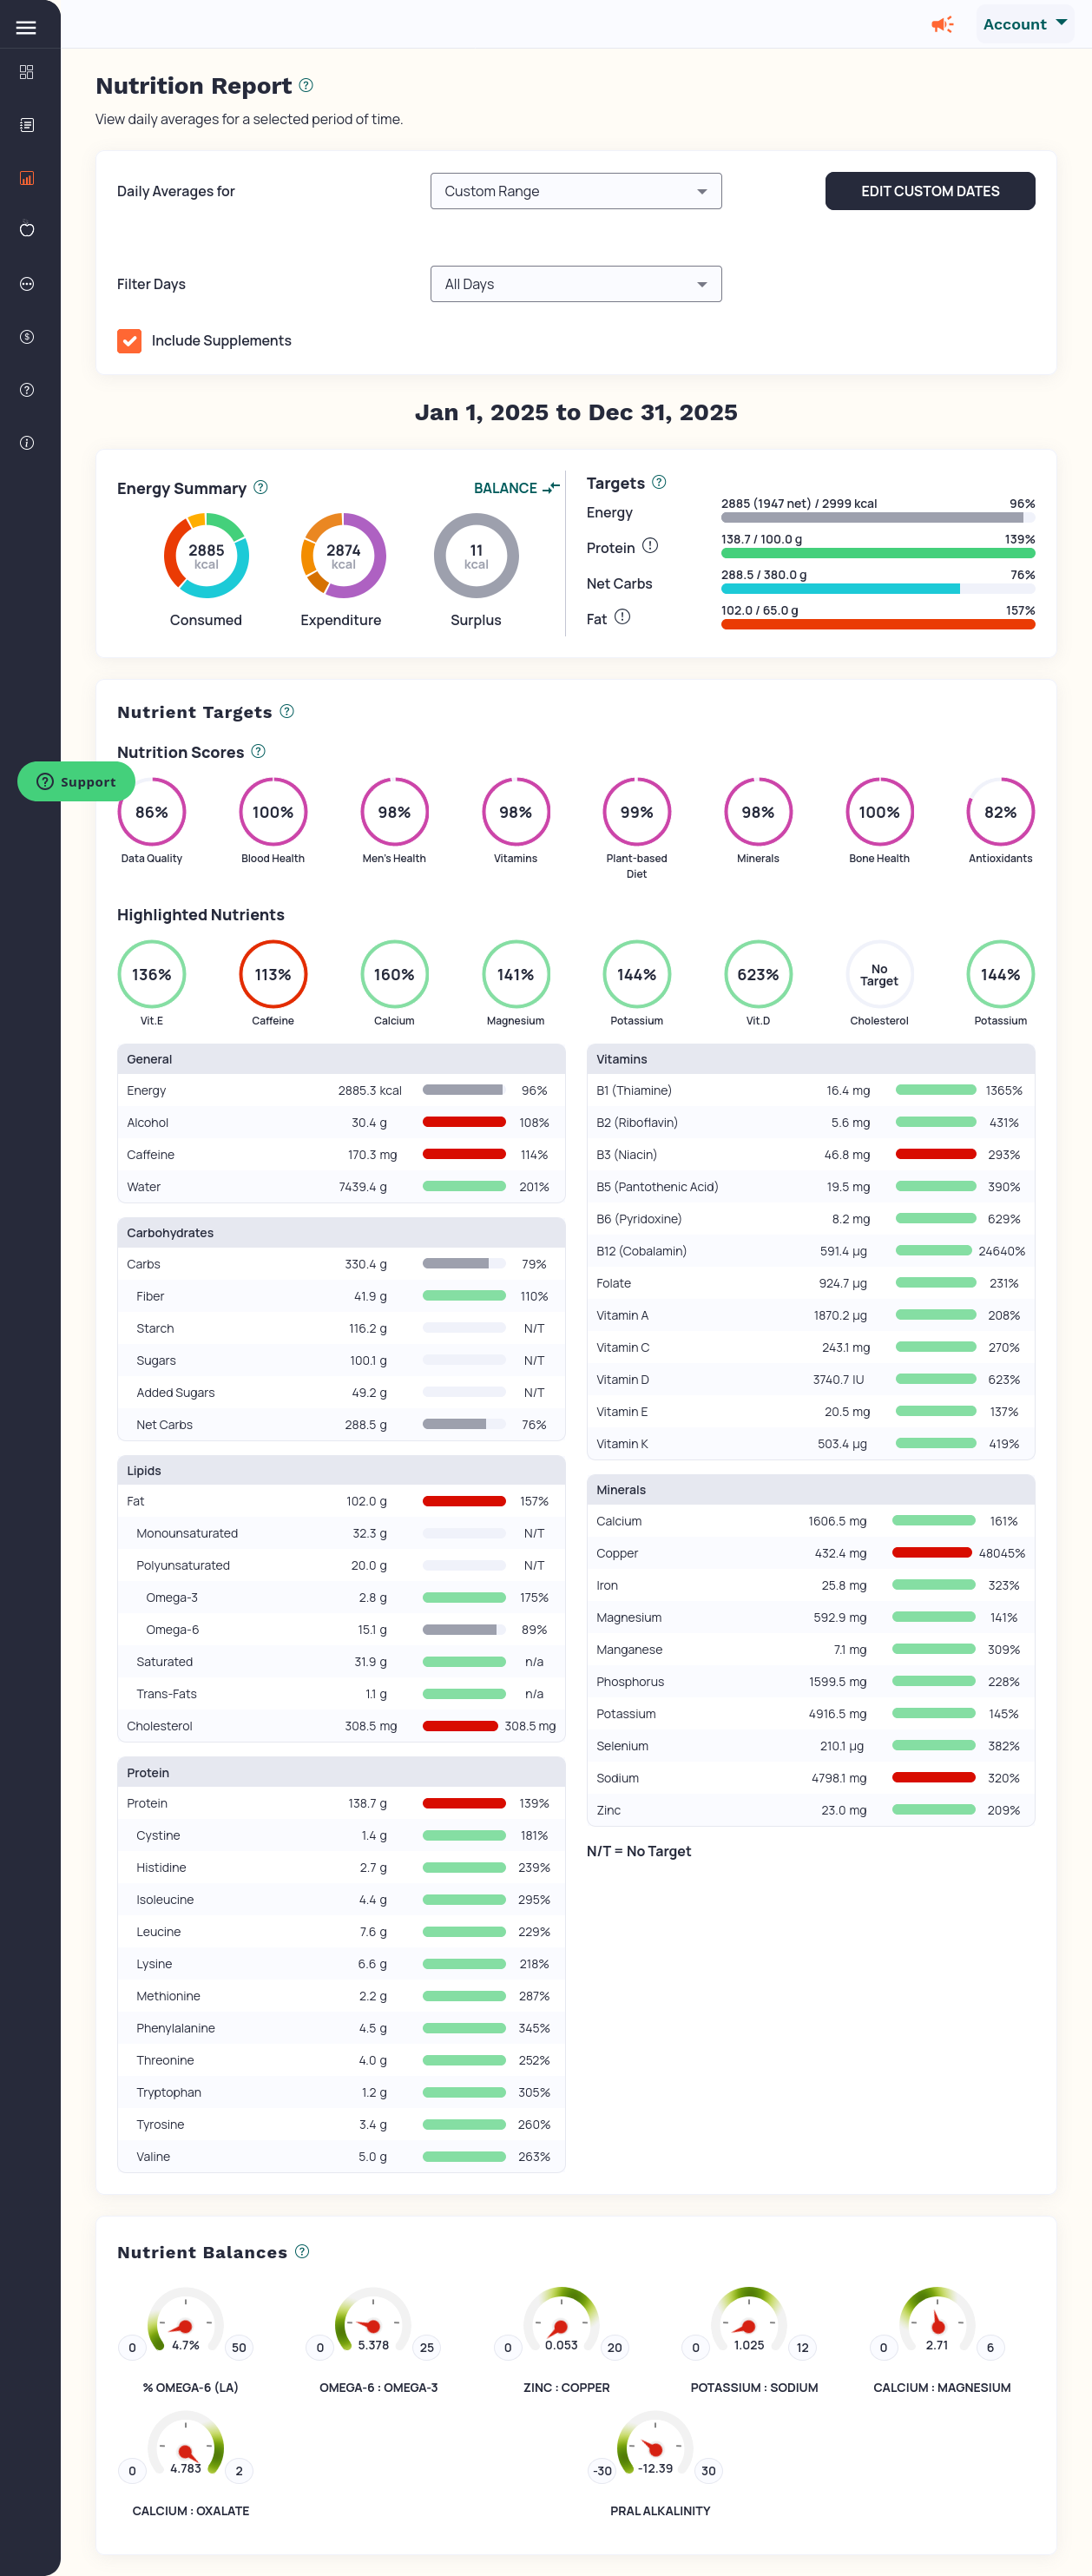
Figure 3: Annual Daily Average Nutrition
I’ll start with the good this year instead of the bad:
- From a macro/micronutrients perspective things were very dialed in again. Without supplementation I only had a slight deficiency in the usual two vitamins: Vitamin D and Vitamin E. With supplementation via a multi-vitamin and Vitamin D drops things were well within limits.
- Sodium levels while elevated were lower than last year. This category is tricky because I need to supplement with salt because of all my running. At this point as long as blood pressure is staying within limits, see next section, I’m not going to worry as much about the elevated sodium levels.
- Even though more recent evidence is showing that the Omega-3/6 fatty acid ratios aren’t as predictive for heart health as previously thought I do like seeing that in the green zone.
Next on to the not so good:
- Caffeine levels were once again just above the 150 mg per day I set, but was slightly lower than last year
- Alcohol consumption was slightly above the 28 grams per day that I set as an upper bound. This is just straddling about 2 drinks a day. Most of my alcohol consumption is wine/champagne. This works out to just under 2 glasses of wine, about 9.75 glasses of red wine. However beer makes up a part too. 28 grams normalized by ever day beer has this as about 26.25 ounces of beer, so 2.25 ounces more than two drinks a day.
- Fiber was down a bit from last year but still above the RDA level for the second year in a row.
- The alkanity score was slightly lower than last year, although still the second best score I had by far. I’m using this metric to crudely estimate how fruit/veggie heavy as a proportion of calories my diet is see this explainer .
- Cholesterol too was up from last year, another indication of not eating as plant heavy as I would like but still not completely horrible. There is no longer an RDA on dietory cholesterol levels but previous guidance that I’m still using as a rule of thumb said to limit it to 200 mg per day if had heart disease risk factors. I personally try to target half that rate as a means of driving into more plant-based eating.
I wish I could have been a bit more dialed in when not on these long trips, which added up to about two months of the year. The fact that even with all that down pressure on grades I still had things more dialed in than most previous years looks pretty good to me.
Body Composition
One note if you look at those old graphs is that it looks way lower than current values since the scale setting I was using was different. Once I started getting regular DEXA scans and saw that a different setting matched the measured DEXA reading I had to go back and correct values. I never updated old posts though.
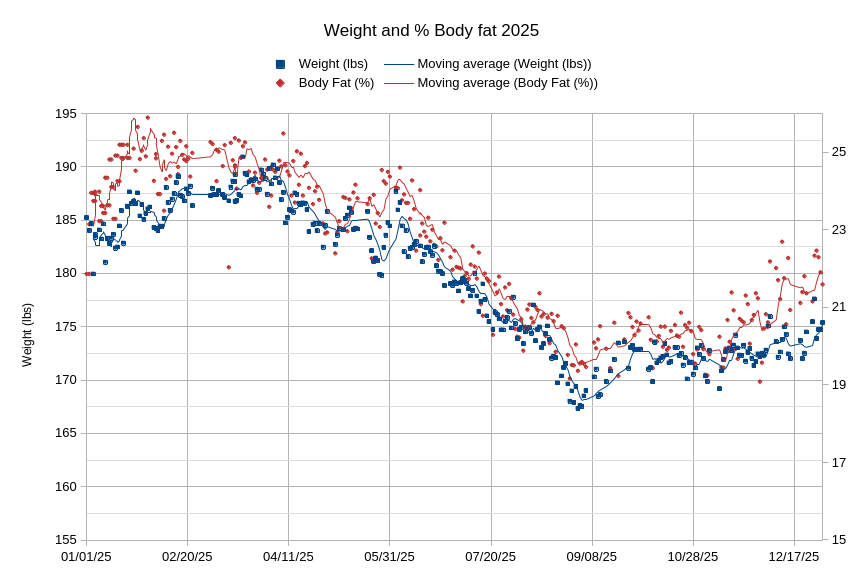
Figure 4: Annual Body Fat and Weight History
Coming out of 2024 I had had some rebound in my percent body fat and weight. It was nowhere near as high as it was at the start of 2023 but it wasn’t at the levels I was looking for. I’m shooting for a body composition hovering around 20% body fat, give or take a couple points in either direction. Weight I don’t necessarily care about but with my current training regime the two do mostly change in tandem. So starting the year I was just slightly over the target levels. Over that trip in the beginning of the year they jumped up a couple points and remained there until I started trying to drive them down in the second quarter.
Once I worked out that I would be doing a marathon at the end of the year I had a bit of a problem. I knew that I had another month long trip in September which I was certain would add a couple points of body fat through. I wanted to end the year within range. Without a marathon I could just bleed off some of the body fat upon returning. However with an early December marathon that would mean I would be trying to drop a few pounds while also ramping up distances for marathon training. I didn’t want to do both at the same time. I therefore decided to intentionally overshoot the weight loss in the 3rd quarter and first part of the 3rd quarter. Those levels still stayed within the +/- 2 percentage point values but it was a bit leaner than I would normally be trying for. In fact looking at my previous data I think it was the leanest I’ve been ever, at the very least the leanest I’d been in 20 years.
Like last year, the last two months of the year were pretty bad on a body composition change level. I actually kept the Halloween Candy issue more in check than last year but still over-indulged eventually. There was also a trip mid-December, after the marathon, where training is at a minimum during recovery but eating was at higher levels. All that plus holiday eating led to quite the bump up in body composition by the end of the year. The values are just at or above the +/- 2 points limits that I’m trying to hold to. So it is just a question of getting things leaned out a bit in the beginning of next year, to the tune of about 3 pounds of fat, to get things back to the 20% median I’m looking for.
When I was overshooting in August I kept doing a sanity check of whether I thought I felt “lean enough vs too lean”. I sort of eyeballed feeling at the ideal lower end range around the end of July/beginning of August. I don’t know if the “feeling it” was about the body composition or more about being sick of being in calorie deficit, albeit not an excessive one, for several months. As I mentioned above I have been exploring Intuitive Eating. There is a concept of a “set point weight/composition” which basically is a natural weight our bodies try to target. A lot of that is driven by genetics and where our body compositions settled out through adolescence. Going too far off target in each direction causes the body to try to re-establish the equilibrium. I’m wondering how much of that could be driven by that. Again, that’s something I want to explore in posts here eventually.
Speaking of net calories, one can get idea of what that looks like over the year below:
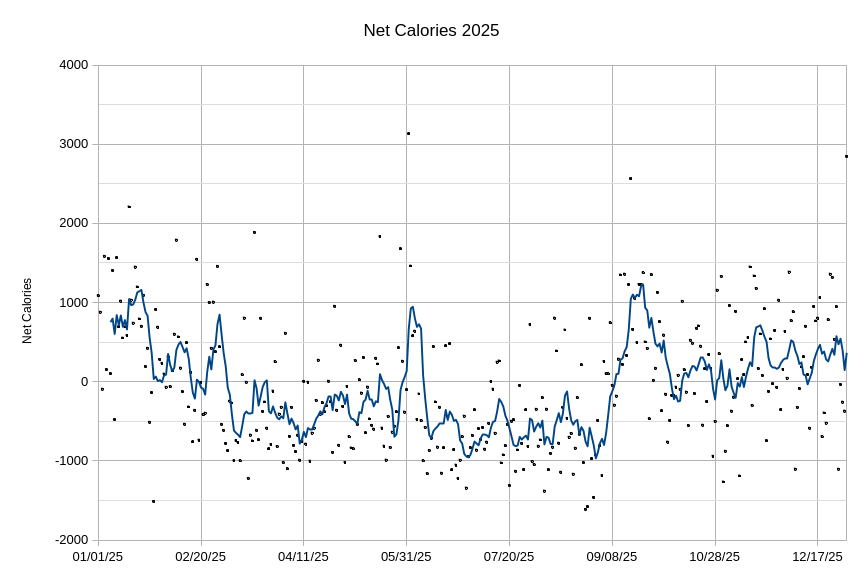
Figure 5: Annual Net Calories History
While there can be some individual big swings day to day, the trend line shows what it looks like when I’m on trips or in excessive consumption phases. One of these days I’d love to see this as a multi-month trend oscillating around the zero point versus these sorts of larger swings. It is possible that’s just not how people eat in the real world and things just settle out eventually. Overall though the important thing is that the food tracking calorie balance calculations are matching the body composition changes. While this chart is adjusted by the yearly average error estimate the daily correction value is a -58 calorie per day change. In other words, on the above screenshot that has Cronometer showing an avereage surpluss of 11 calories per day, the actualy value is about 47 calorie deficit per day. That’s about a 2% error. Considering all the variations in accuracy in estimating food masses, calorie burn during activities, et cetera I think that sort of correction is more than reasonable error level.
Biometrics
This is the first time I have the more complete set of biometric data in a way I think can present here digestibly. I wish the data processing was all automated but for now it’s still hand jamming it into a spreadsheet.
I switched smart watches from Apple Watch to Garmin in the first week of February. Metrics like Resting Heart Rate (RHR) and Heart Rate Variability (HRV) can come out differently between different watch systems. For example, Apple Watch measures heart rate variability throughout the day. Garmin only measures it while sleeping. Usually its the trend that is more important than the absolute value. So for this data set, the first month is with Apple Watch and the rest is with Garmin. Trends before/after have a bit of that caveat at play.
This is the first time I’m presenting Heart Rate Variability (HRV) data . It’s sort of a measure of how responsive your heart is to changes in demand from activities. There are typical non-clinically worrying ranges people will have. For an individual that tracks these changes it can be indicative of something like over training, illness, over-stress, not enough sleep, et cetera. when it drops below that person’s standard value range. The chart below is for my values.
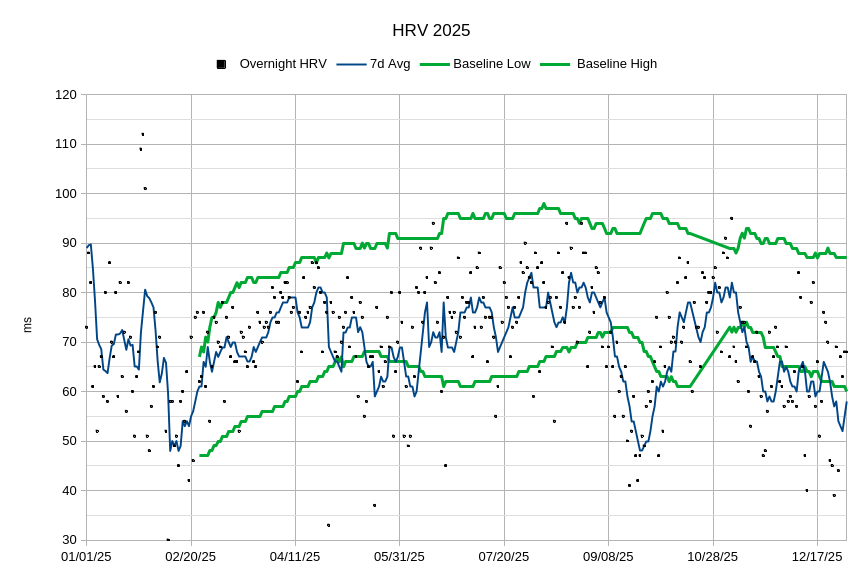
Figure 6: Heart Rate Variability History
The green bars show Garmin’s estimate of my near-term typical expected range of HRV. It takes a few weeks of measurements to build up and then adjust, hence some of the wonkiness early in. Looking at the graph it is easy to see some areas where the HRV dropped below the target ranges. The easiest one to spot right away is the one around September. That’s the period of time where I was eating and drinking a lot on a long trip. You can see it recovered pretty quickly after that but then dipped again. That second dip is actually from when I was ramping up my marathon training. A less clear one can be seen in the April/May time frame. That too was a period of exercise build up when I was adding swimming, more weight training, and more cycling to my workout. In both of those cases I was pushing myself a bit too much. Things settled out ultimately in both cases, or would have in the latter case if end-of-year holidy indulgences didn’t also contribute. I’ll be keeping a closer eye on HRV during training and correlating that to how I’m feeling over longer periods to make sure I don’t get into over-training on some of the bigger build ups I know my coach is going to have in store for me later this year.
In terms of the alcohol effects on HRV I can start to see the effects pretty quickly. While there were some days in the year where I got a legit buzz, and even one where I got legit drunk, alcohol consumption over the day even when blood alcohol levels stay very low is still enough to reduce HRV values. I’ve been trying to figure out a way to test what the absolute smallest dosage is. Even two drinks shows a small dip, but still within HRV normal bounds for me. It is when I start getting into the 4 or more drinks a day that things really start to take a beating. Yes, that is true even if I had those drinks slowly over a correspondingly long period of time so there is no blood alcohol level spike. It’s an indicator of why long term excessive drinking is not a heart healthy thing whereas moderate drinking probably isn’t problematic from an HRV perspective.
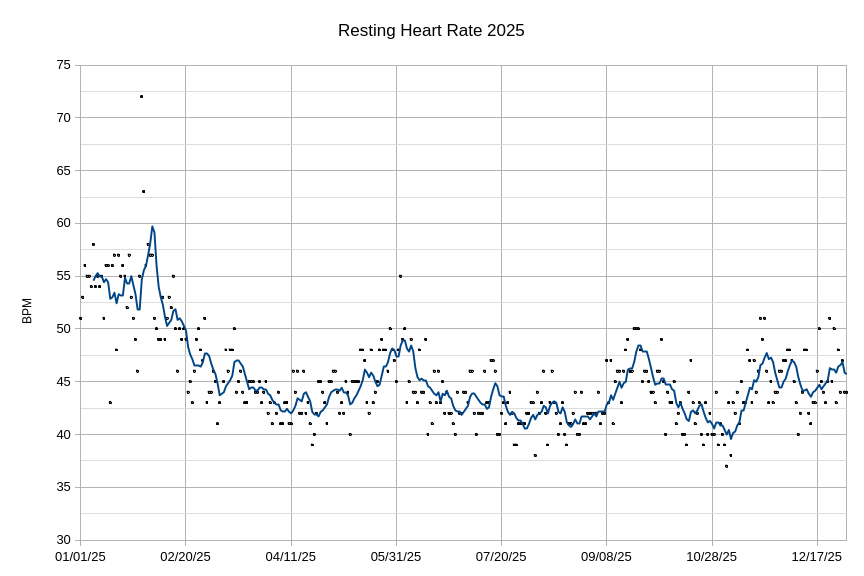
Figure 7: Resting Heart Rate History
Resting heart rate showed a similar variation over the year as HRV, although in this case the trends always stayed within averages. It started off the beginning of the year the highest 7 day averages actually peaked just below 60 but had a steady state in the mid-50s. During my peak of leaning out over the summer the averages dropped into the low-40s. It did it again in the lead up to the marathon build up, actually bottoming out just under 40, before a pretty fast ramp up that I imagine was a combination of the training volume increase and over-indulgences. Smeared out over averages, even with the excessive consumption, excessive loading from marathon training and marathon, and the body composition changes, once I got my weight into the mid-180s and lower, things stayed in the 40s range from the end of February onwards. That’s lower than most people but the usual range for me when my aerobic fitness is dialed in.
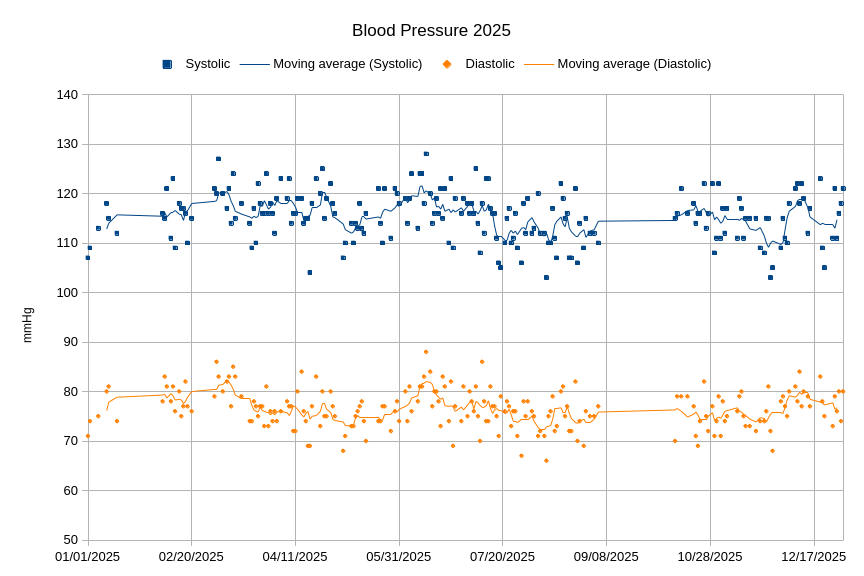
Figure 8: Blood Pressure History
Blood pressure also looked good throughout the year. There are definitely variability throughout. A few weeks the diastolic pressure 7 day moving average crept up a bit over 80 in March and again in June. It quickly returned to my target of 120/80 or lower and an average of 115/77 for the year. I’d prefer that the averages never broke 120/80 and I’d prefer if the averages were more like 110-115/70-75. However these numbers look okay. I want to study them more but this last year has further driven my opinion that once my weight/composition is in the proper range, which it has been for a couple years now, a big driver of keeping my blood pressure in the “good range” is a proper potassium/sodium ratio balance. It’d be great if I was one of those people not sensitive to sodium levels going too high for my body but I’m not one of them. I am glad that even when things have been off the rails my blood pressure still didn’t go to the point of needing pharmaceutical interventions yet. I’m hoping to keep it that way if at all possible.
Looking forward to 2026
While this year was pretty solid I wish it were as good or an improvement on 2025, factoring out the longer trips. I can’t complain at all about my results in the exercise department. I am so far behind on posts about races I’ve run and progress I’ve made on performance. Sleep could use a little tweaking. The lament on diet is the same as it has always been. Could diet be better? Yes. Is it horrible? No. It appears to still be dialed in sufficiently that my biometrics and blood tests are holding in a good range. So for the first four goals everything will stay the same. The one area I feel I need to tweak is Brain Health.
As I said above, the Brain Health is about maintaining cognitive ability over my remaining decades. I zeroed in on meditation because it helps with learning how to be more present, settling the mind, et cetera. That probably has other health benefits beyond just the mental part, but I figured it was a good thing to dial in on. I had hoped that by doing so I would become less indulgent on faster media, specifically social media. I had hoped that dropping the algorithmically driven big tech social media would also help. Years later I still piss away too much time on those things. While the studies to date seem to be saying that the only site that really has degraded mental performance from spending too much time on social media is Tik Tok (see notes from this HowTown YouTube video references sheet ) I still feel like I’m just not able to absorb long form information as much as I used to be able to. I think it may be a shorter effect that can be reversed relatively quickly. I also think that it’s better for my mental health to not be following the play by play of the unfolding disasters.
To take all that into account what I intend to do is change the Goal #5. I think in a steady state world I should be limiting my consumption of short form current events news and social media to probably an hour a day. I want to continue with the meditation and alternative learning, which I think is still helpful. The “alternative learning” is about learning things that stretch my brain. So learning more about something I know a lot on, say programming in Dart, isn’t going to cut it. But learning a new foreign language would. A combination of these three, but most importantly the time boxing of the social media and current events timeline, I think will help my mental fitness overall. The goals I will be starting off the year with, and potentially see through the end of the year if I can sustain it on #5 are below. If it turns out to be too far a gap then I may back off on the Goal #5 to create more winning momentum to build back to the 1 hour number.
- Goal 1 (Diet): Eat a plant dominant Mediterranean diet averaging at least 100 grams of protein a day, a stretch goal of over 120 grams of protein
- Goal 2 (Sleep): Get 7-8 hours of sleep a night
- Goal 3 (Cardio Health): Meet training plan goals set by coach
- Goal 4 (Non-Cardio Health): Meet training plan goals set by coach
- Goal 5 (Brain Health): 15-20 minutes of meditation or alternative learning (chess/language/Coursera/etc). Limit social media and current events news time to 1 hour a day.