This is an update on my monthly blog stats generated with my non-tracking The BlogStatViewer
program. I followed the same steps as in April
post for refining the updates to make sure that bots/spiders/etc aren’t in the statistics. This month it took a grand even less time although I’m still having to filter out about a half dozen new bot IPs again.
At the very top level of statistics I had 3515 views across my whole blog from 2166 unique IP addresses. That’s up quite a bit from April of 2776 and 1755, respectably. The top ten IP addresses with the most number of views are below. I had another stand out reader that read several articles each day. It was either the slowest most irregular bot or a person. I’m choosing to believe the latter.
Position
# Views
1
65
2
36
3
36
4
34
5
22
6
20
7
19
8
18
9
17
10
17
The top stories that were linked to all are with respect to software development, including the coverage of the Basecamp debacle. Again the overwhelming majority of the top stories were around Avalonia
development with the same Kotlin I/O one thrown in as well. An interesting store for the month was when a friend of my partner’s commented that he was doing internet searches for Avalonia tutorials and started doing mine before he realized that it was me. As I’ve written before I basically write stuff for myself that I think will be helpful for others too. It therefore always brings a smile to my face when I hear stories like that. Below is the table of the stories with their link counts:
The rest of the statistics I'm interested fall into:
* Referrer for that view, which is broken down into internal and external referrers. An "internal" referrer is basically following a link from the blog itself. An external referrer is from a search engine, a link from another website, a social media link etc. Browsers don't necessarily provide this information though and if they went to the post directly there isn't referrer information either.
* The browsers of the viewer that visited the site. This is a bit nebulous because browsers often impersonate other browsers. Some browsers don't fill in the data at all. I'm just taking the signatures at face value for the major browsers.
* The operating systems the viewers' browser is running on. Again this isn't always available in the data and may be impersonated. Just as with the browser I'm taking the values at face value.
Graphs and percentages discussed below within a category are for only visits that I had the information to analyze. The fraction of the visits that had that information will be mentioned as well though. First let's look at the referrer information
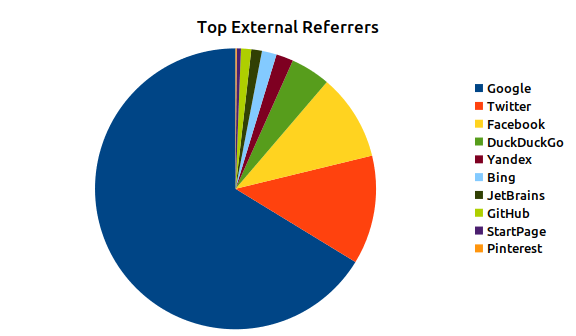
Figure 1: May 2021 Top External Referrers
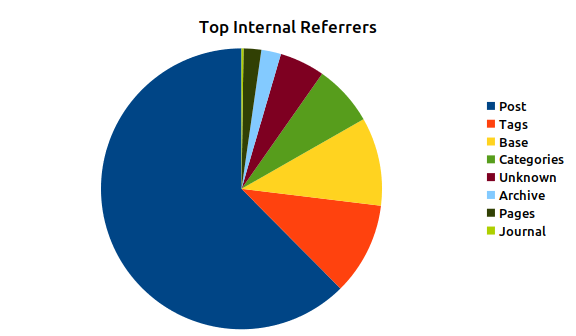
Figure 2: May 2021 Top Internal Referrers
Looking at the external referrers Google is again the most dominant, with 66% of all externals, down from 77%. This is driven substantially by the huge surge in referrals from Twitter and Facebook. The reason for this dramatic change is that my frequency of posting went through the rough in May. I wrote two posts in January, zero in February, three in March, and another three in April. I wrote nineteen in May alone. A lot of that is being driven by writing movie reviews of as part of my "first run movie challenge". While none of those review posts got enough clicks to break into the top ten they still got a lot of extra traffic in aggregate.
In terms of internal referrers the biggest chunk of referrers are users clicking through from one post to another post that it linked to. Posts stay the biggest chunk followed by base and Tags, which swapped spots.
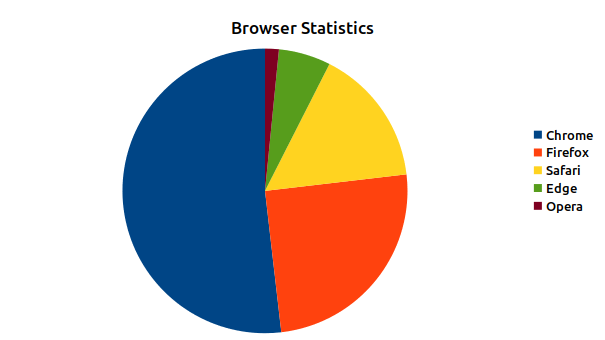
Figure 3: May 2021 Browser Statistics
In terms of browser data Chrome edged up a lot from 48% to 52% of views and Firefox increased slightly from 23% to 25%. Safari picked up two percentage points to 15% and somehow Opera got enough to get its own sliver.
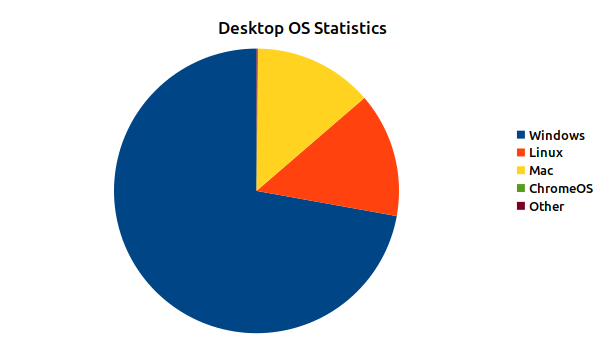
Figure 4: May 2021 Desktop OS Statistics
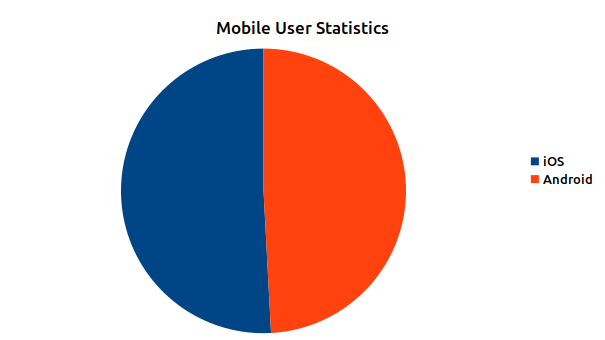
Figure 5: May 2021 Mobile OS Statistics
Lastly lets look at the operating system statistics. From the desktop perspective Windows dominates even more with over 72% of the views, up from 63%). Linux just barely nudged out Mac with 14% to Mac's 13%. Mobile OS speaking the dominance of Android from last month became a nearly even split with iOS just barely nudging out Android with 51% to its 49%
## Conclusion
I'm pretty excited to see how much increased posting frequency is increasing the blog traffic even if it's not a tremendous amount of extra volume. Getting into the habit of writing more frequently is something I've been trying to do for some time. This movie challenge has been a good impetus to get momentum into that process. I'm hoping I keep it up. I'm also pleased that the stats process has continued to be a low maintenance thing. Yeah it needs some tweaks but it's working well so far.


 2021-06-04
in
2021-06-04
in

 5 min read