


 2021-04-11
in
2021-04-11
in

 7 min read
As I wrote in my previous post two months ago I deployed my own custom made blog/static site statistics generation tool. March was the first month that I have full statistics on since the Nginx logs that were processed in the early part of March, when I finally deployed it, go back into late February. With this first month down I decided to review my blog’s statistics and share them with the internet as well. I don’t think I’ll necessarily be doing monthly updates of my blog statistics but at the very least I could see doing annual ones. The ultimate schedule is TBD but let’s look at this first month’s statistics. All of these statistics have the bots/spiders/automated systems excluded from them. This includes things like Fediverse servers hitting a post as it federates across the network and it hits the link to generate OpenGraph information, RSS feed reader systems, etc.
At the very top level of statistics I had 2716 views across my whole blog from 1822 unique IP addresses. That means most people came to the blog for one post and left. There were people who came back for multiple views though. The top ten IP addresses with the most number of views are below. The one outlier one is that 84 post person. That’s a lot of reading and very atypical. Could it be a bot? I reviewed the access history and it is either an unnecessarily sophisticated bot or it’s a real user. What do I mean by that? Bots tend to be very methodical how they march through a site. The stupid ones just spam a site. The not so stupid ones hit a few articles all at once, take a rest, then do it again. They do that at very regular intervals though. This viewer’s statistics don’t look like that at all. They are irregular. They follow topics not just topics linked within a post, etc. I’m therefore leaving them in for now.
| Position | # Views |
|---|---|
| 1 | 84 |
| 2 | 34 |
| 3 | 18 |
| 4 | 15 |
| 5 | 15 |
| 6 | 14 |
| 7 | 11 |
| 8 | 10 |
| 9 | 10 |
| 10 | 10 |
The top stories that were linked to all are with respect to software development. Since I haven’t been blogging much on recipes, fitness, longevity, nutrition, etc. this makes sense. The overwhelming majority of the top stories were around Avalonia development. Kotlin had one in the top with the story on native I/O. There was another on my JavaFX Apple Silicon M1 benchmarks. Lastly there was one about having local NuGet dependencies on Linux. Below is the table of the stories with their link counts:
Top 10 Links:
The rest of the statistics I’m interested fall into:
- Referrer for that view, which is broken down into internal and external referrers. An “internal” referrer is basically following a link from the blog itself. An external referrer is from a search engine, a link from another website, a social media link etc. Browsers don’t necessarily provide this information though and if they went to the post directly there isn’t referrer information either.
- The browsers of the viewer that visited the site. This is a bit nebulous because browsers often impersonate other browsers. Some browsers don’t fill in the data at all. I’m just taking the signatures at face value for the major browsers.
- The operating systems the viewers’ browser is running on. Again this isn’t always avalailable in the data and may be impersonated. Just as with the browser I’m taking the values at face value.
Graphs and percentages discussed below within a category are for only visits that I had the information to analyze. The fraction of the visits that had that information will be mentioned as well though. First let’s look at the referrer information
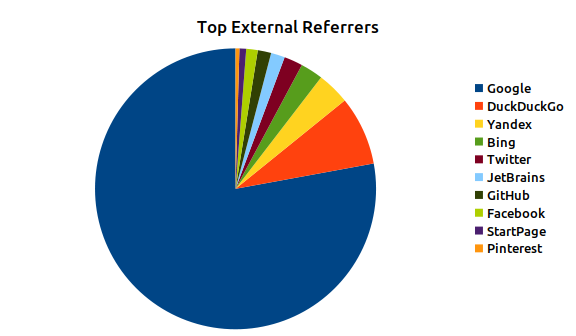
Figure 1: March 2021 Top External Referrers
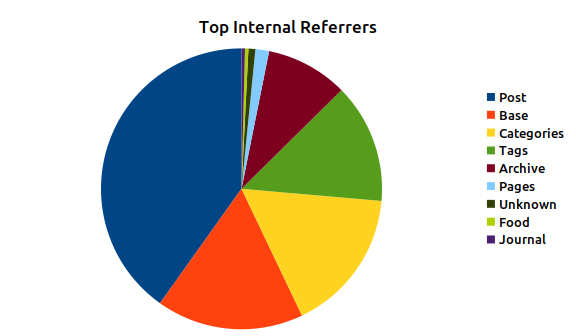
Figure 2: March 2021 Top Internal Referrers
About 75% of the views had referrer information, between internal and external referrers. Looking at the external referrers it’s obvious, and not remotely surprising, that the biggest referrer is Google web searches. DuckDuckGo , a great alternative search engine that is my go-to search tool, comes in a very distant second. In reality a lot of those DuckDuckGo results are probably an artifact that I use their search engine for the blog search tool in my menu bar. I’d be willing to bet almost all of those are actually just from that. The rest of the field are a mix of other sites. It is interesting that the JetBrains and GitHub are actually bigger referrers than Facebook, but just less than Twitter. For the JetBrains one I’d bet much of that came from Khalid Abuhakmeh’s blog post on .NET Development on Apple Silicon where he mentions my benchmarks.
In terms of internal referrers the biggest chunk of referrers are users clicking through from one post to another post that it linked to. The next two biggest were the main website itself followed by the Category index page, with Tags index page and Archives index page trailing them slightly.
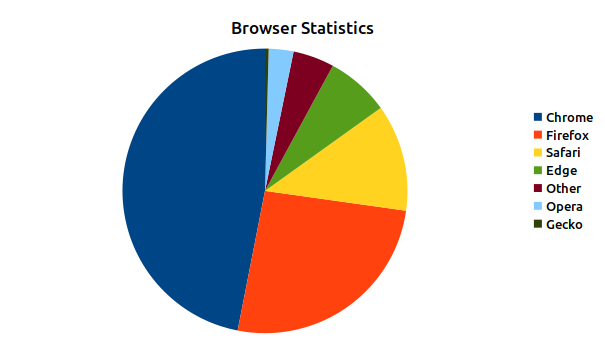
Figure 3: March 2021 Browser Statistics
Browser data was a lot easier to come by, with 98% of the views having browser information. While Chrome was the biggest browser it wasn’t even a majority one, with 47% of the views. Firefox came in a distant second with 26% followed by Safari with 12%. I’m guessing the Safari numbers are a lot of iOS views but I didn’t want to do the whole mobile/desktop browser breakdown for browser statistics. Interestingly Edge, Opera, and Gecko browsers are showing up too, with the “other” category being browser strings that it couldn’t identify. The tool doesn’t have the most complicated browser string logic so it’s very possible those belong allocated into one of the other buckets.
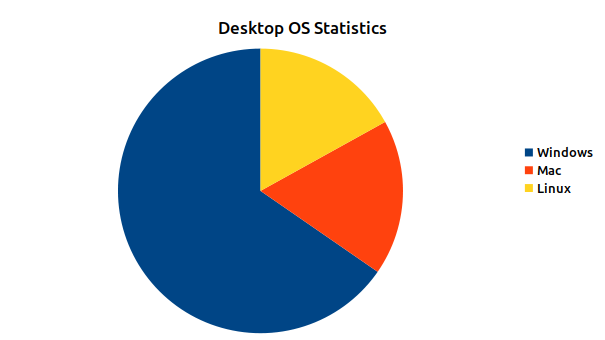
Figure 4: March 2021 Desktop OS Statistics
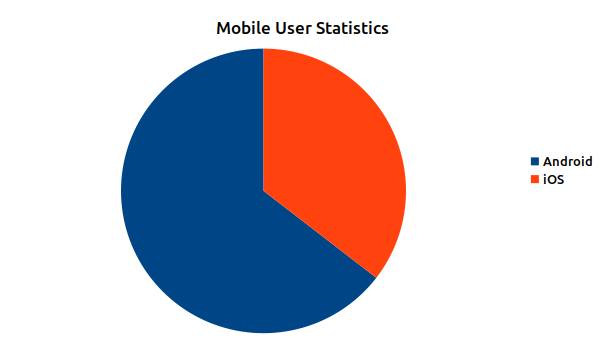
Figure 5: March 2021 Mobile OS Statistics
Lastly lets look at the operating system statistics. 96% of views had parsable operating system information. From the desktop perspective Windows dominates with almost two thirds of the views but Mac and Linux split the difference between remaining pie. In test runs on older log data during development I actually had some other operating systems in there, like OpenBSD, but not for the month of March. At least I know it can recognize them though. Mobile side Android dominates with almost 65% of the iOS picking up the rest with 35%.
Conclusion
What to make of this first month of statistics? First, I’m pretty pleased to see that I’m getting as many views as I am. None of them are me or anyone at home/office either since I block out my known IP addresses. Yes it is just under ten a day on average, but that’s nine more a day than I was expecting.I don’t write this blog to be an “influencer”, hence it’s scattered topics and lack of real polish. I write it as a personal journal that I’m sharing with the world in case it is useful for others. I actually use it a lot as reference material when I am going back to relearn something or recall something I thought I had written about previously. I’m pleased that the Browser and OS information isn’t the typical distributions you’d expect to see. They are far more diverse. The search engine results are unfortunately more inline with what you’d expect, especially once you get rid of the DuckDuckGo links that probably mostly came from an intra-blog search query.
The big takeaway though is that my blog statistics tool is giving me the type of data I’ve been missing since I went from Wordpress to a Jekyll statically generated blog. For that I’m very stoked.